Edit chart
Loading graph
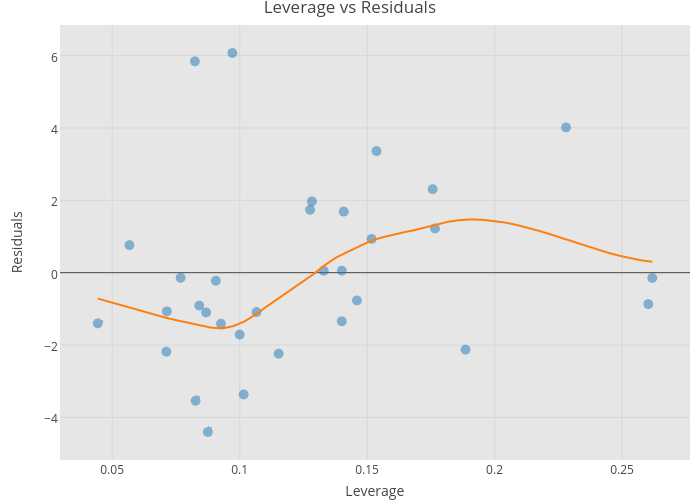
Riddhiman's interactive graph and data of "Leverage vs Residuals" is a scatter chart, showing Data vs Smooth; with Leverage in the x-axis and Residuals in the y-axis.. The x-axis shows values from 0.03089138926291439 to 0.2752394052107044. The y-axis shows values from -5.13131622991089 to 6.80009701358398.