Edit chart
Loading graph
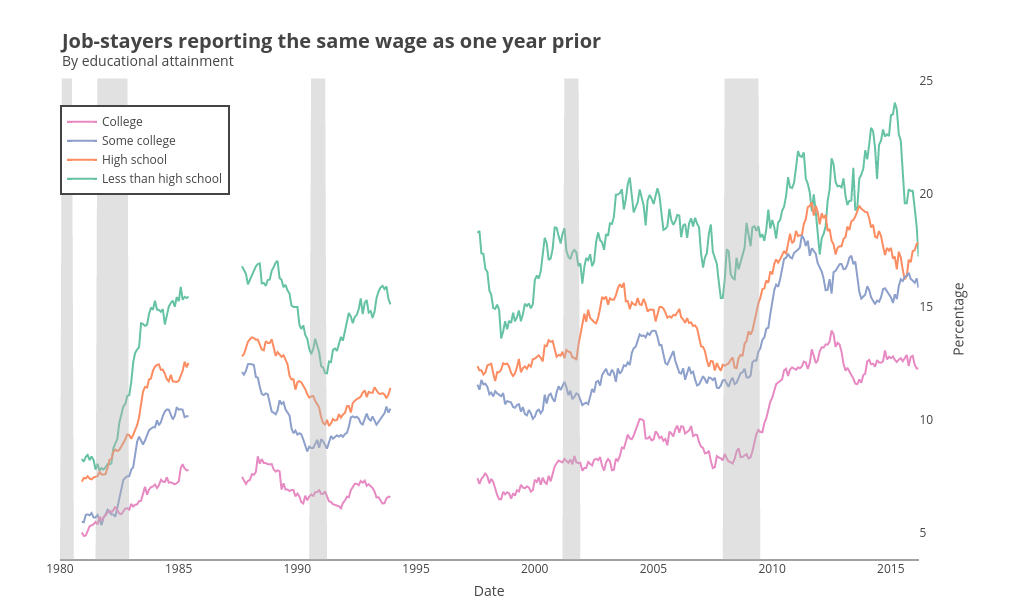
Riddhiman's interactive graph and data of "Percentage vs Date" is a line chart, showing Less than high school, High school, Some college, College; with Date in the x-axis and Percentage in the y-axis.. The x-axis shows values from 315513000000 to 1456770600000. The y-axis shows values from 3.818292228833333 to 25.111311672166668. This visualization has the following annotation: Job-stayers reporting the same wage as one year priorBy educational attainment