Edit chart
Loading graph
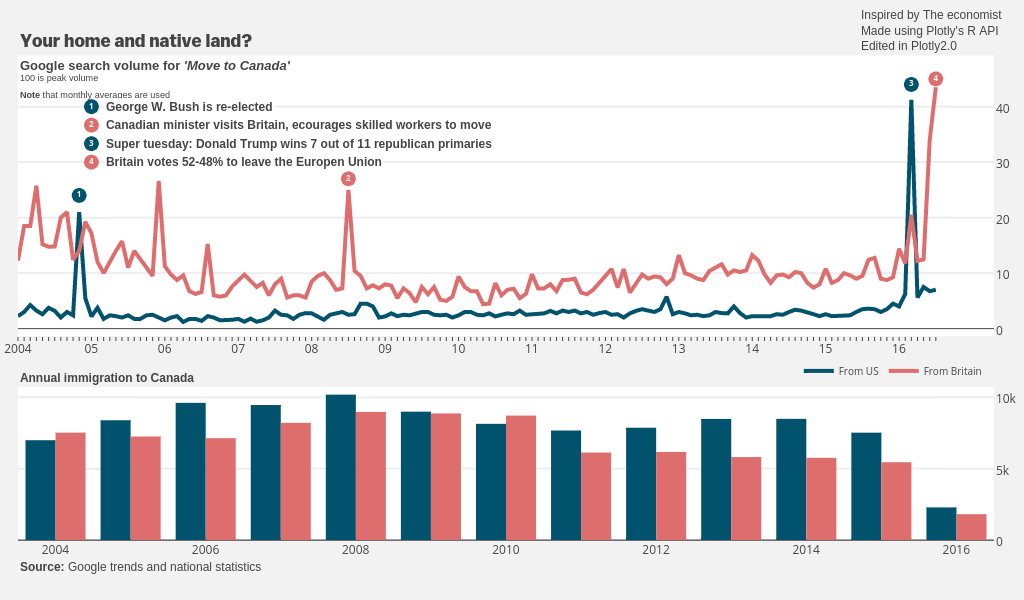
Riddhiman's interactive graph and data of "From US, From Britain, Trace 2, y; Trace 6, y, Trace 3, y; Trace 7, y, Trace 4, y, Trace 5, y, Trace 2, y; Trace 6, y, Trace 3, y; Trace 7, y, Trace 8, y, USA, UK" is a line chart, showing From US, From Britain, Trace 2, y; Trace 6, y, Trace 3, y; Trace 7, y, Trace 4, y, Trace 5, y, Trace 2, y; Trace 6, y, Trace 3, y; Trace 7, y, Trace 8, y, USA, UK. The x-axis shows values from 2004 to 2017.2922942826792. The y-axis shows values from -1.3271829682196852 to 49.21647639617402. This visualization has the following annotations: Your home and native land?; Google search volume for 'Move to Canada'100 is peak volumeNote that monthly averages are used; George W. Bush is re-elected; Canadian minister visits Britain, ecourages skilled workers to move; Super tuesday: Donald Trump wins 7 out of 11 republican primaries; Britain votes 52-48% to leave the Europen Union; Annual immigration to Canada; Source: Google trends and national statistics; Inspired by The economistMade using Plotly's R APIEdited in Plotly2.0