Edit chart
Loading graph
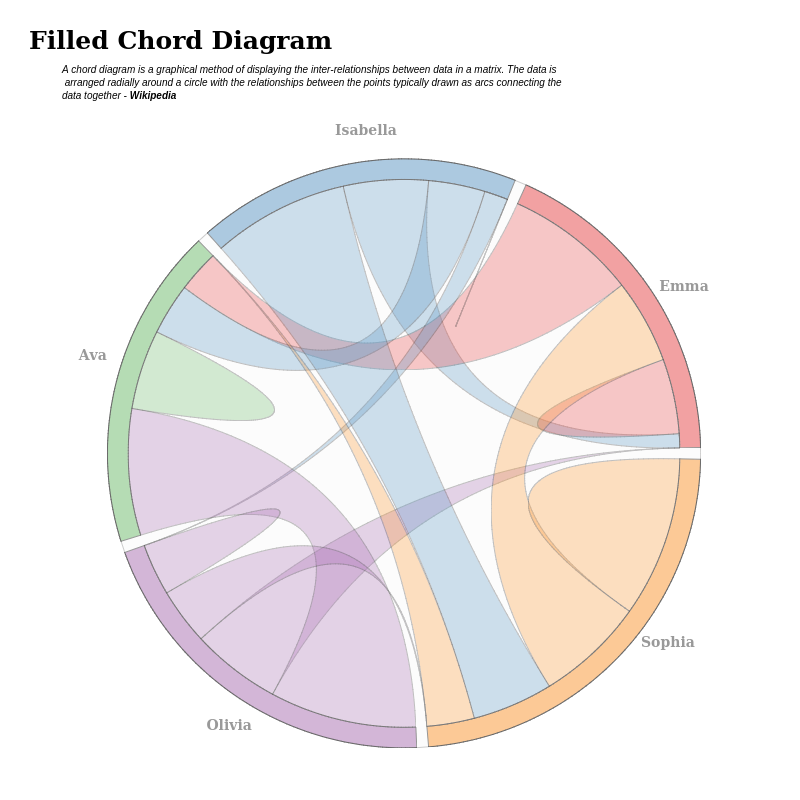
Riddhiman's interactive graph and data is a . The x-axis shows values from -1.1599191287951052 to 1.0550417151597982. The y-axis shows values from -1.041054073463622 to 1.2048130347644959. This visualization has the following annotations: Filled Chord Diagram; A chord diagram is a graphical method of displaying the inter-relationships between data in a matrix. The data is arranged radially around a circle with the relationships between the points typically drawn as arcs connecting thedata together - Wikipedia