Edit chart
Loading graph
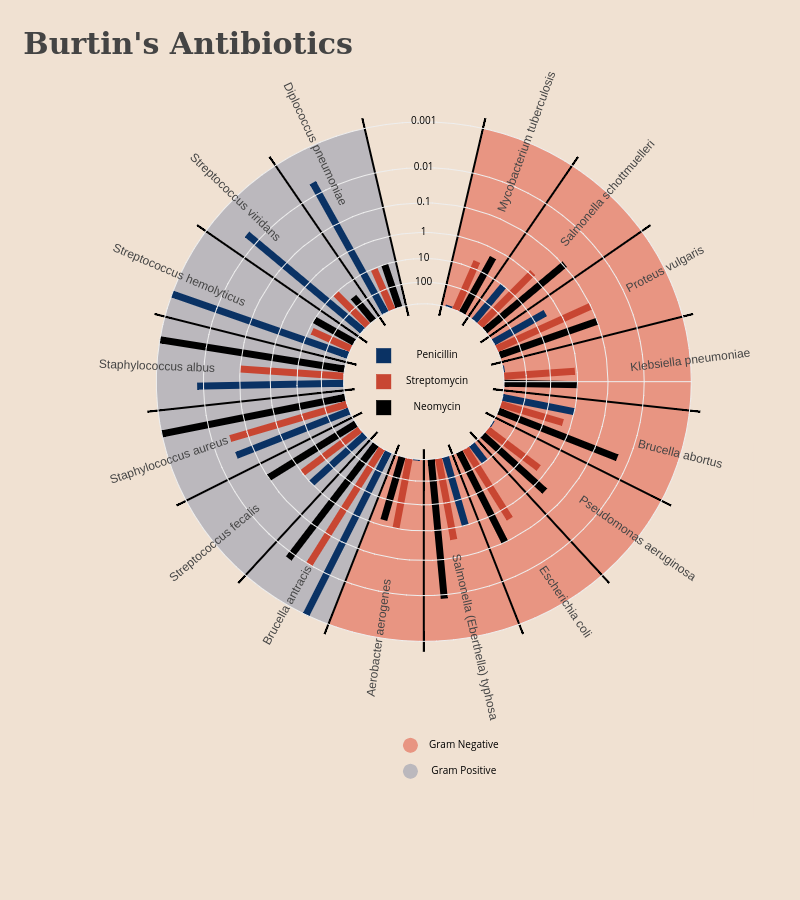
Riddhiman's interactive graph and data is a filled line chart. The x-axis shows values from -1.2207298212744433 to 1.2240604993148423. The y-axis shows values from -1.6803447353379988 to 1.2063233925961026. This visualization has the following annotations: Mycobacterium tuberculosis; Salmonella schottmuelleri; Proteus vulgaris; Klebsiella pneumoniae; Brucella abortus; Pseudomonas aeruginosa; Escherichia coli; Salmonella (Eberthella) typhosa; Aerobacter aerogenes; Brucella antracis; Streptococcus fecalis; Staphylococcus aureus; Staphylococcus albus; Streptococcus hemolyticus; Streptococcus viridans; Diplococcus pneumoniae; Burtin's Antibiotics