Edit chart
Loading graph
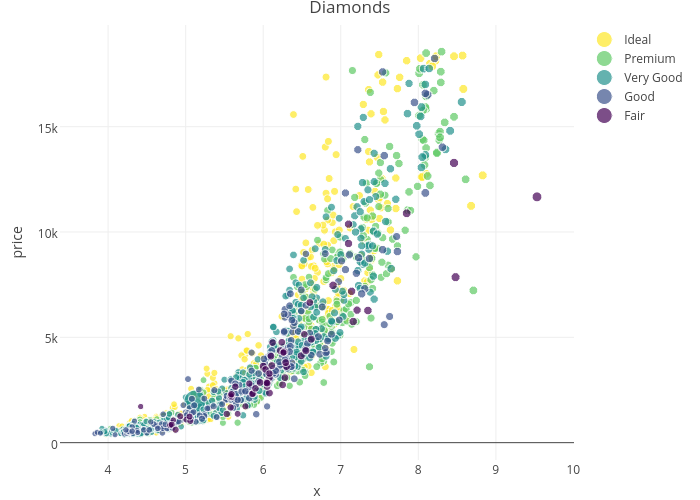
Riddhiman's interactive graph and data of "Diamonds" is a scatter chart, showing Ideal, Premium, Very Good, Good, Fair; with x in the x-axis and price in the y-axis.. The x-axis shows values from 3.4499213114410456 to 9.921936026109295. The y-axis shows values from -778.1070494336905 to 19763.455580901475.