Edit chart
Loading graph
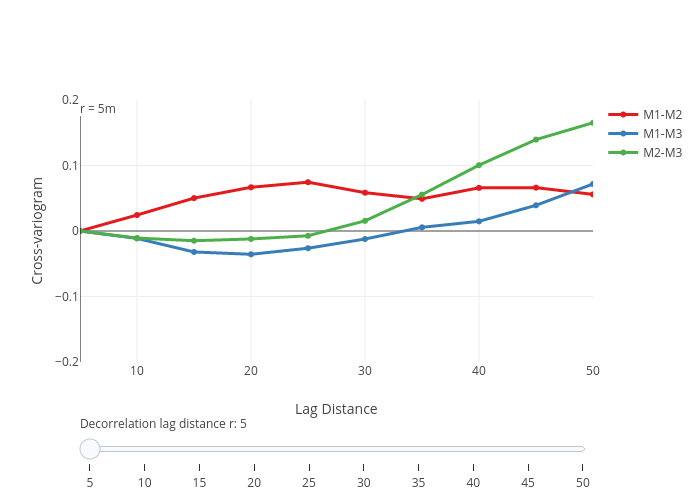
Rmbarnet's interactive graph and data of "Cross-variogram vs Lag Distance" is a line chart, showing M1-M2, M1-M3, M2-M3; with Lag Distance in the x-axis and Cross-variogram in the y-axis.. The x-axis shows values from 5 to 50. The y-axis shows values from -0.2 to 0.2.