Edit chart
Loading graph
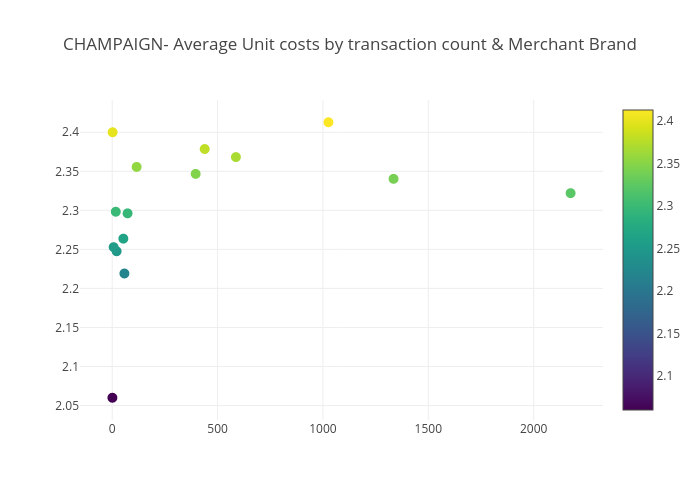
Rmulani2's interactive graph and data of "CHAMPAIGN- Average Unit costs by transaction count & Merchant Brand" is a scatter chart, showing Transactions. The x-axis shows values from 0 to 0. The y-axis shows values from 0 to 0.