Edit chart
Loading graph
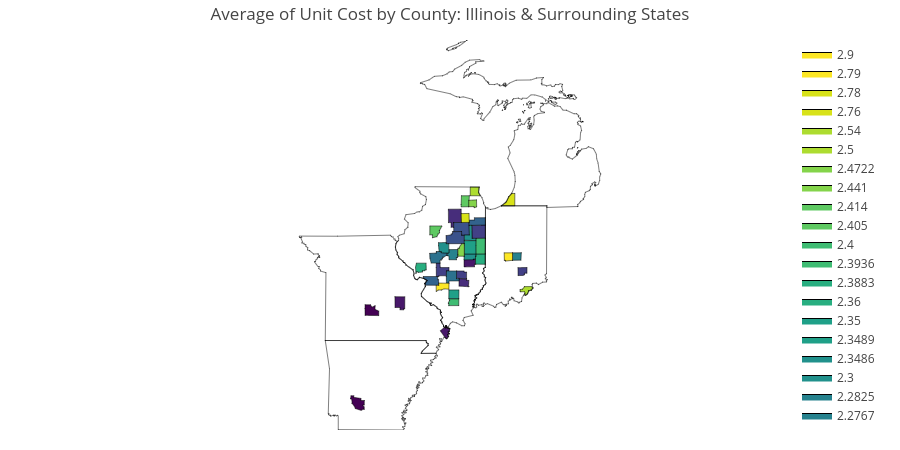
Rmulani2's interactive graph and data of "Average of Unit Cost by County: Illinois & Surrounding States" is a filled line chart, showing 1.98, 2.06, 2.1, 2.105, 2.15, 2.16, 2.18, 2.2, 2.2214, 2.24, 2.2467, 2.25, 2.255, 2.2619, 2.2767, 2.2825, 2.3, 2.3486, 2.3489, 2.35, 2.36, 2.3883, 2.3936, 2.4, 2.405, 2.414, 2.441, 2.4722, 2.5, 2.54, 2.76, 2.78, 2.79, 2.9, US Counties. The x-axis shows values from -108.13603299999998 to -70.053453. The y-axis shows values from 33.004106 to 48.237137999999995. This visualization has the following annotation: