b2b
mobile commerce
big data analytics
predictive analytics
saas
social media platforms
location based services
technology
internet of things
retail technology
small and medium businesses
computer vision
mobile advertising
big data
medical devices
advertising platforms
data mining
mobile health
lead generation
messaging
developer apis
fitness
human resources
artificial intelligence
hospitality
k 12 education
social media
brand
language learning
restaurants
robotics
social travel
crowdsourcing
hotels
personal finance
video streaming
insurance
manufacturing
productivity software
semantic search
bioinformatics
cloud data services
fantasy sports
finance technology
photo sharing
sales automation
blockchains
consumer electronics
deep learning
enterprise security
0
5
10
15
20
25
30
35
40
1M
1M
1-10M
10-50M
50-100M
100-1000M
plotly-logomark
Edit chart
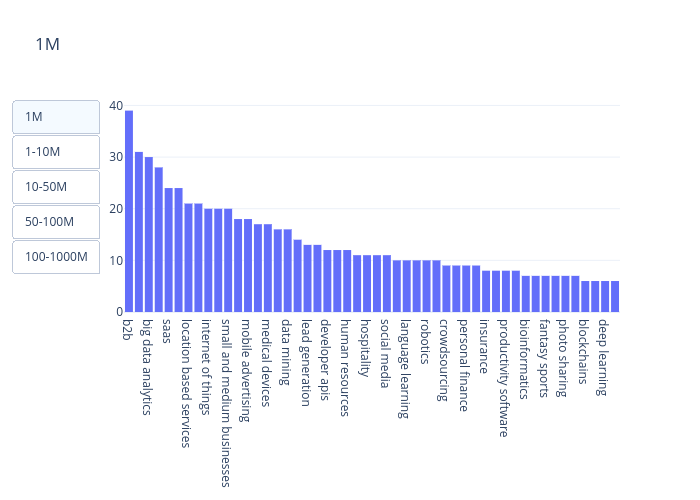
Rodrigonader's interactive graph and data of "1M" is a grouped bar chart. The x-axis shows values from -0.5 to 49.5. The y-axis shows values from 0 to 41.05263157894737.