Edit chart
Loading graph
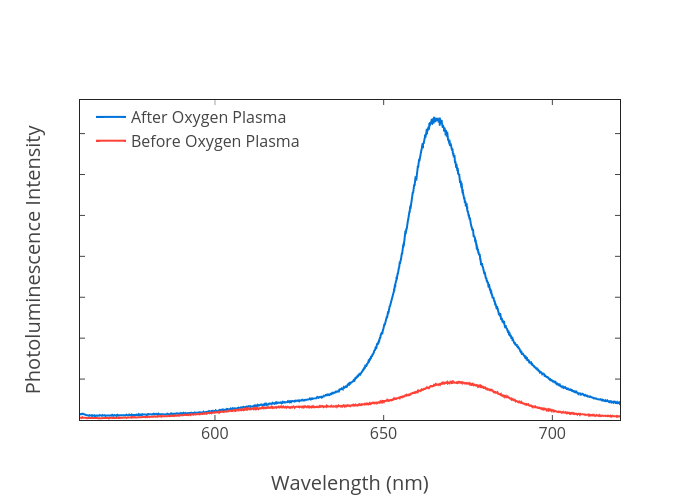
Rohandhall's interactive graph and data of "Photoluminescence Intensity vs Wavelength (nm)" is a scatter chart, showing After Oxygen Plasma vs Before Oxygen Plasma; with Wavelength (nm) in the x-axis and Photoluminescence Intensity in the y-axis.. The x-axis shows values from 560 to 720.049. The y-axis shows values from -1.6801149999997 to 39105.351585.