Edit chart
Loading graph
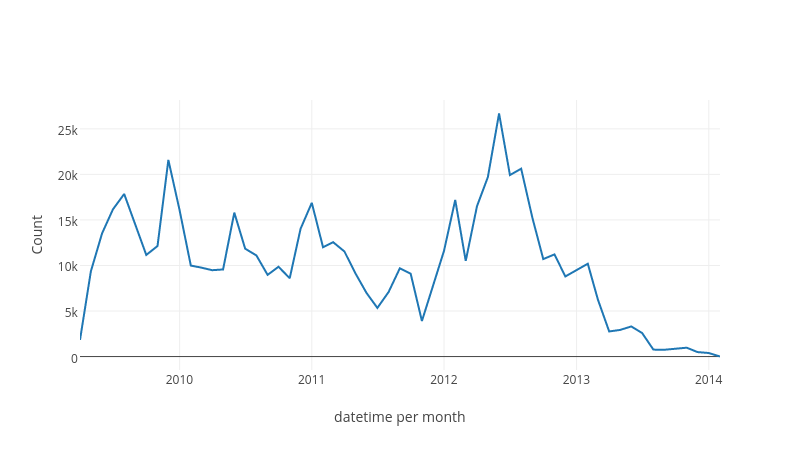
Rolisz's interactive graph and data of "Count vs datetime per month" is a line chart, showing Count; with datetime per month in the x-axis and Count in the y-axis.. The x-axis shows values from 1238569200000 to 1391238000000. The y-axis shows values from -1477.1666666666667 to 28166.166666666668.