Edit chart
Loading graph
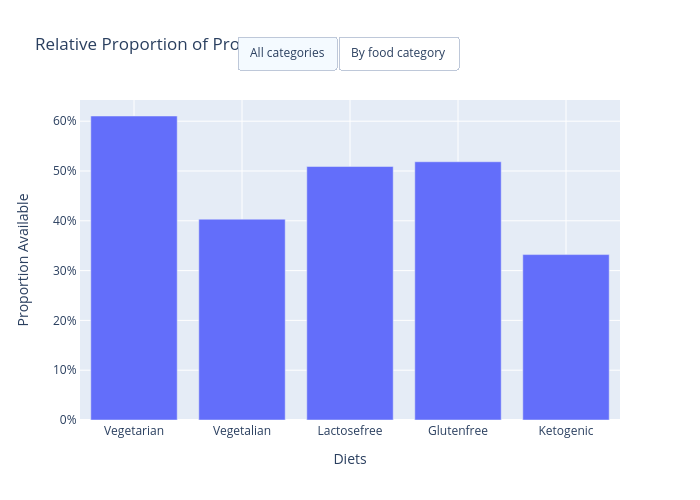
Romi514's interactive graph and data of "Relative Proportion of Products" is a bar chart, showing ; with Diets in the x-axis and Proportion Available in the y-axis.. The x-axis shows values from -0.5 to 4.5. The y-axis shows values from 0 to 0.6425586684224907.