Edit chart
Loading graph
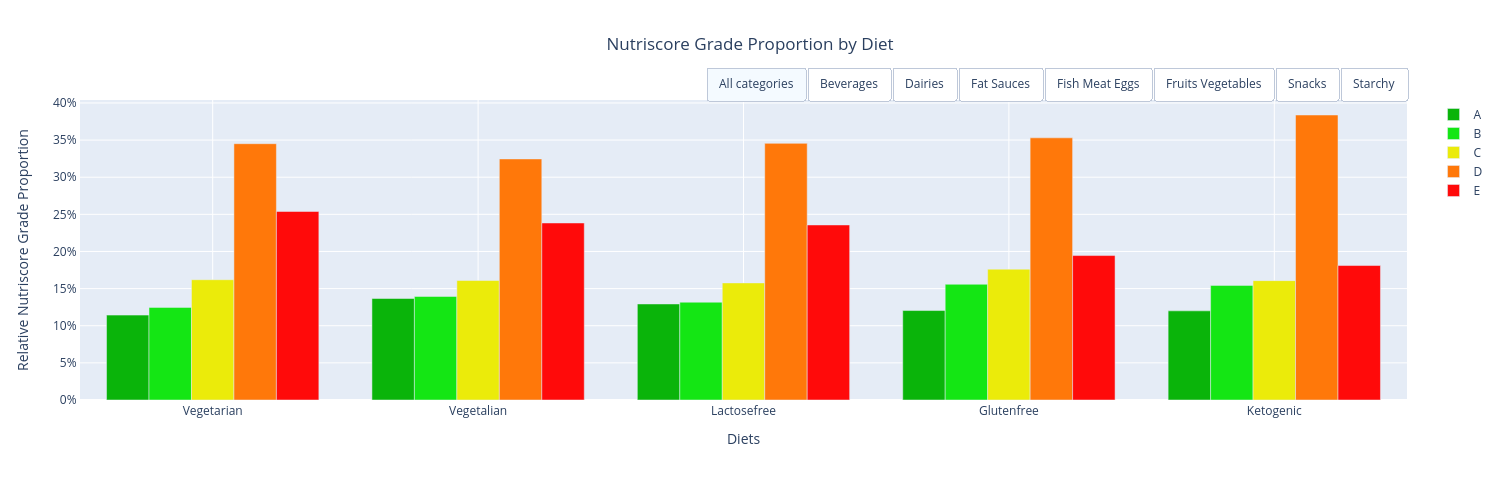
Romi514's interactive graph and data of "Nutriscore Grade Proportion by Diet" is a bar chart, showing A, B, C, D, E; with Diets in the x-axis and Relative Nutriscore Grade Proportion in the y-axis.. The x-axis shows values from -0.5 to 4.5. The y-axis shows values from 0 to 0.40397488856815494.