Edit chart
Loading graph
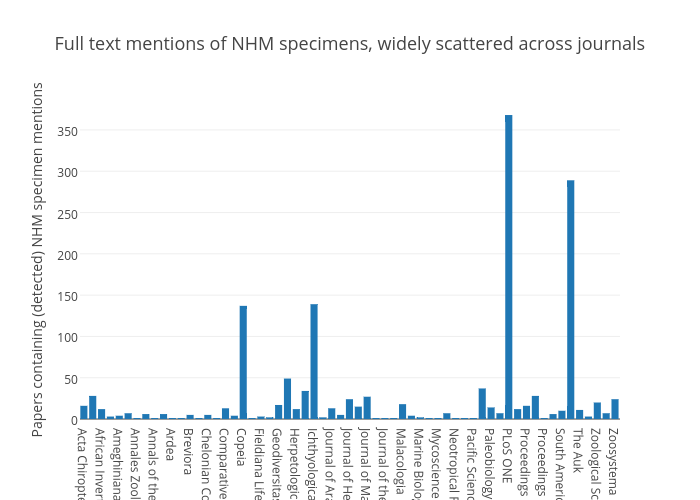
Rossmounce's interactive graph and data of "Full text mentions of NHM specimens, widely scattered across journals" is a histogram, showing Col1; with Papers containing (detected) NHM specimen mentions in the y-axis. The x-axis shows values from -0.4376167894936813 to 60.5623832105063. The y-axis shows values from -1.1781540598251183 to 386.1902669928063.