Edit chart
Loading graph
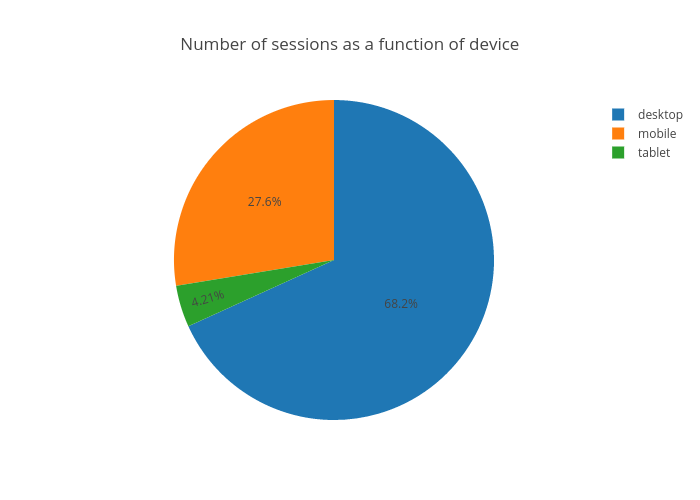
Rrighart's interactive graph and data of "Number of sessions as a function of device" is a pie. The x-axis shows values from 0 to 0. The y-axis shows values from 0 to 0.