Edit chart
Loading graph
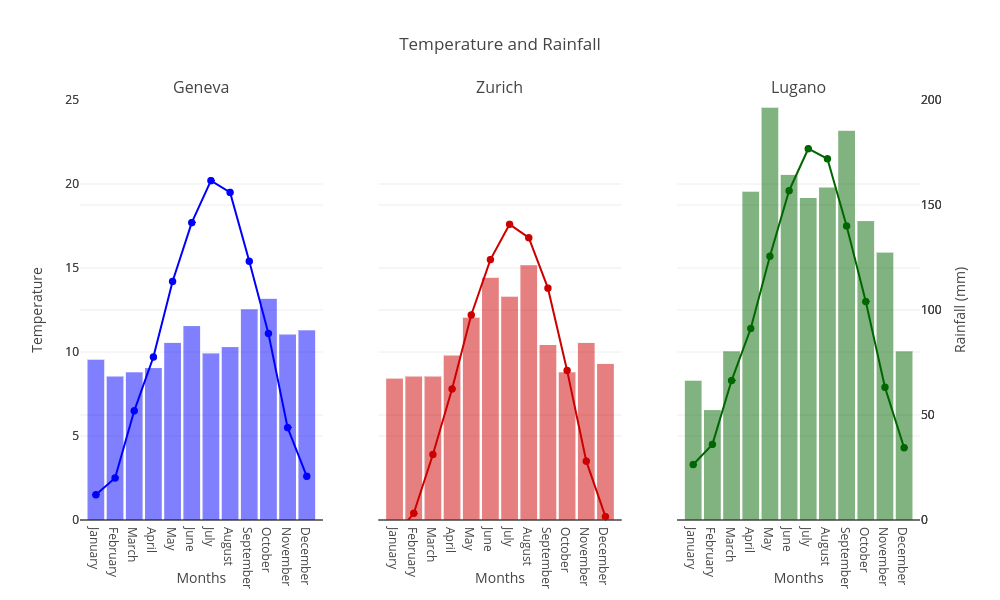
Rrighart's interactive graph and data of "Temperature and Rainfall" is a scatter chart. The x-axis shows values from 0 to 0. The y-axis shows values from 0 to 0. This visualization has the following annotations: Geneva; Zurich; Lugano