Edit chart
Loading graph
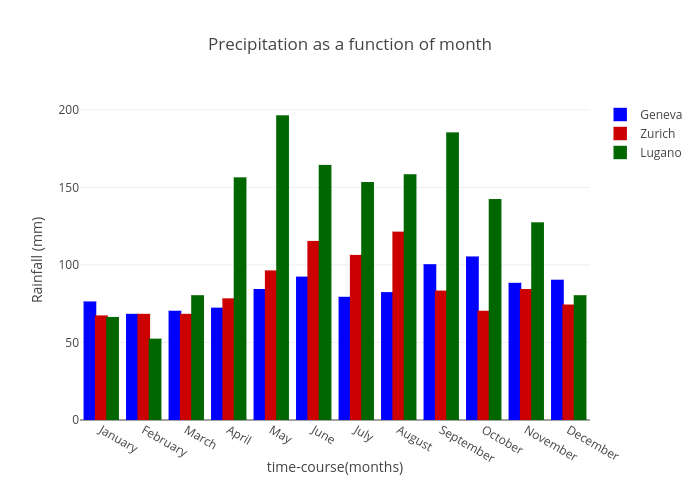
Rrighart's interactive graph and data of "Precipitation as a function of month" is a bar chart, showing Geneva, Zurich, Lugano; with time-course(months) in the x-axis and Rainfall (mm) in the y-axis.. The x-axis shows values from 0 to 0. The y-axis shows values from 0 to 0.