Edit chart
Loading graph
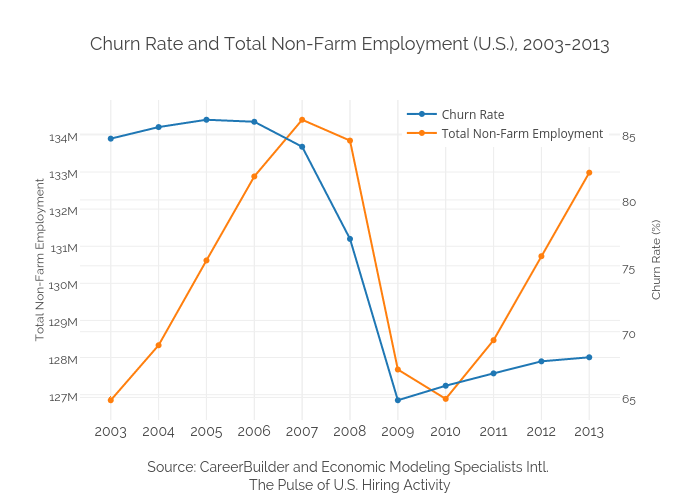
Ryan.hunt14's interactive graph and data of "Churn Rate and Total Non-Farm Employment (U.S.), 2003-2013" is a scatter chart, showing Churn Rate vs Total Non-Farm Employment; with Source: CareerBuilder and Economic Modeling Specialists Intl. The Pulse of U.S. Hiring Activity in the x-axis and Total Non-Farm Employment in the y-axis.. The x-axis shows values from 2002.4058534778178 to 2013.5941465221822. The y-axis shows values from 126366024.78243513 to 134891437.21756488.