Edit chart
Loading graph
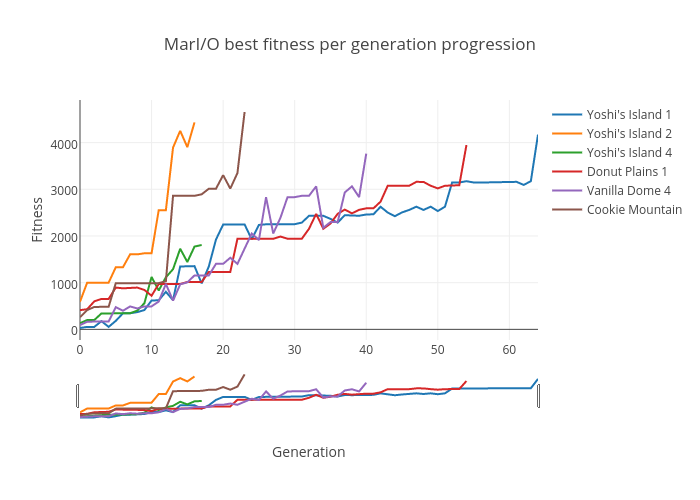
Ryan.scharf's interactive graph and data of "MarI/O best fitness per generation progression" is a timeseries, showing Yoshi's Island 1, Yoshi's Island 2, Yoshi's Island 4, Donut Plains 1, Vanilla Dome 4, Cookie Mountain; with Generation in the x-axis and Fitness in the y-axis.. The x-axis shows values from 0 to 64. The y-axis shows values from -228.02777777777783 to 4912.527777777777.