Edit chart
Loading graph
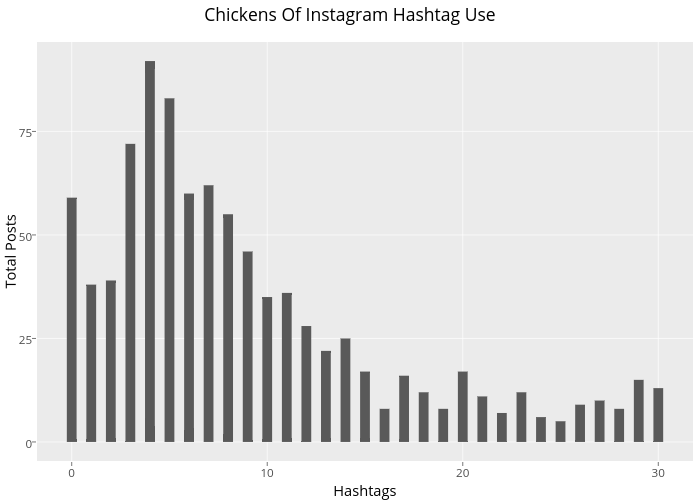
Ryan.sweeney's interactive graph and data of "Chickens Of Instagram Hashtag Use" is a bar chart; with Hashtags in the x-axis and Total Posts in the y-axis.. The x-axis shows values from -1.775 to 31.775. The y-axis shows values from -4.6 to 96.6.