Edit chart
Loading graph
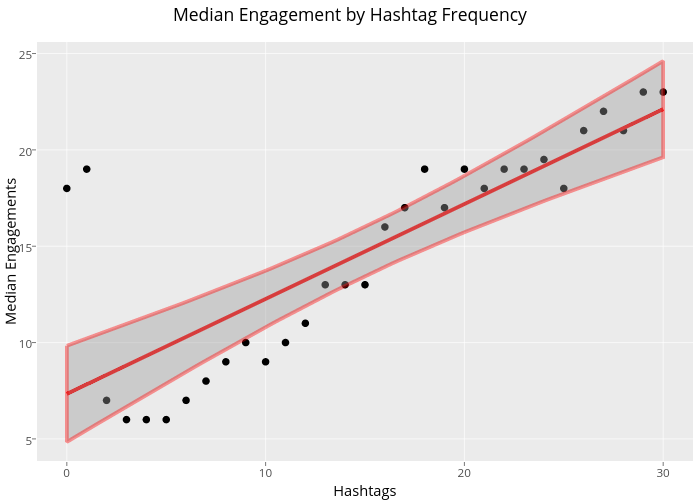
Ryan.sweeney's interactive graph and data of "Median Engagement by Hashtag Frequency" is a scatter chart, showing , fitted values, ; with Hashtags in the x-axis and Median Engagements in the y-axis.. The x-axis shows values from -1.5 to 31.5. The y-axis shows values from 3.85297422273427 to 25.5986386804916.