Edit chart
Loading graph
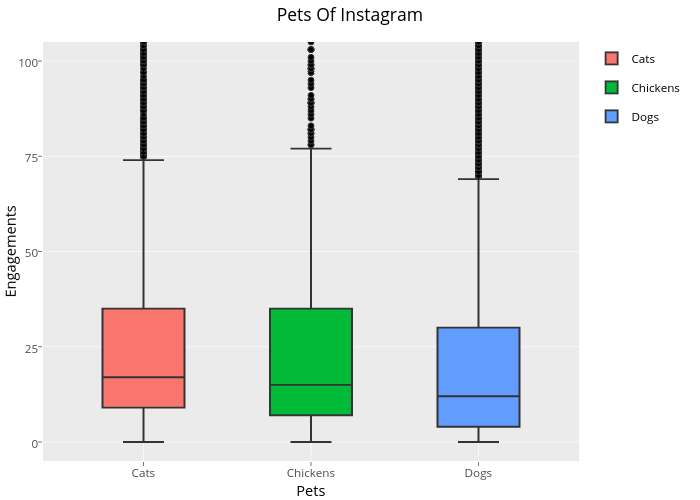
Ryan.sweeney's interactive graph and data of "Pets Of Instagram" is a box plot, showing Cats, Chickens, Dogs; with Pets in the x-axis and Engagements in the y-axis.. The x-axis shows values from 0.4 to 3.6. The y-axis shows values from -5 to 105.