Edit chart
Loading graph
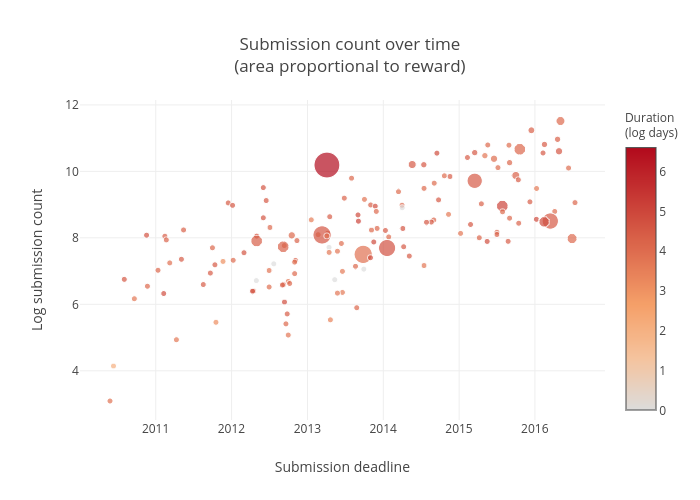
Ryantlee9's interactive graph and data of "Submission count over time(area proportional to reward)" is a scatter chart; with Submission deadline in the x-axis and Log submission count in the y-axis.. The x-axis shows values from 2010-01-14 12:57:35.7729 to 2016-11-20 05:01:24.2271. The y-axis shows values from 2.5698594825565757 to 12.066971394943847.