Edit chart
Loading graph
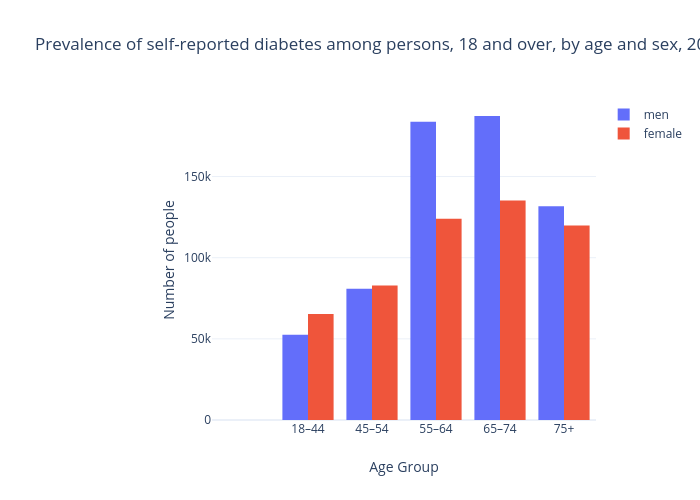
S3582228's interactive graph and data of "Prevalence of self-reported diabetes among persons, 18 and over, by age and sex, 2014-2015" is a bar chart, showing men vs female; with Age Group in the x-axis and Number of people in the y-axis.. The x-axis shows values from -0.5 to 5.5. The y-axis shows values from 0 to 197164.2105263158.