Edit chart
Loading graph
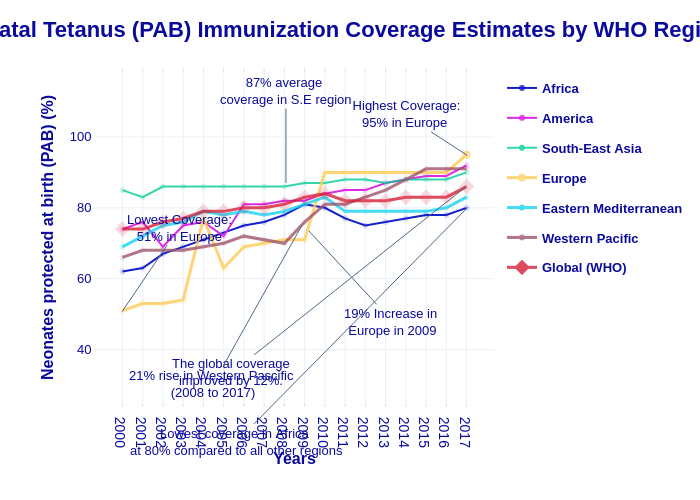
S3792283's interactive graph and data of "Neonatal Tetanus (PAB) Immunization Coverage Estimates by WHO Region" is a , showing Africa, America, South-East Asia, Europe, Eastern Mediterranean, Western Pacific, Global (WHO); with Years in the x-axis and Neonates protected at birth (PAB) (%) in the y-axis.. The x-axis shows values from 18.070135746606336 to -1.070135746606335. The y-axis shows values from 48.05149242469822 to 100.19639491383163. This visualization has the following annotations: Lowest Coverage:51% in Europe; Highest Coverage:95% in Europe; 19% Increase in Europe in 2009; The global coverage improved by 12%. ; 87% average coverage in S.E region; 21% rise in Western Pascific (2008 to 2017); Lowest coverage in Africa at 80% compared to all other regions