Edit chart
Loading graph
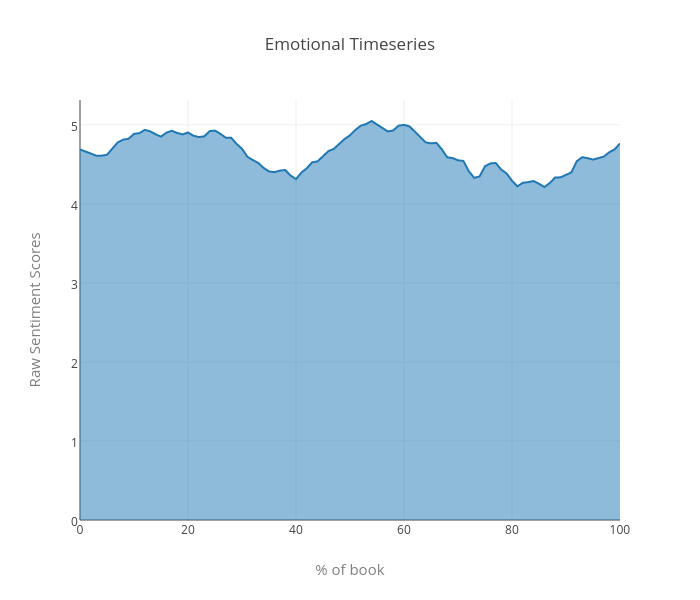
Sagarwal88's interactive graph and data of "Emotional Timeseries" is a filled scatter chart, showing Lord of the Flies; with % of book in the x-axis and Raw Sentiment Scores in the y-axis.. The x-axis shows values from 0 to 0. The y-axis shows values from 0 to 0.