Edit chart
Loading graph
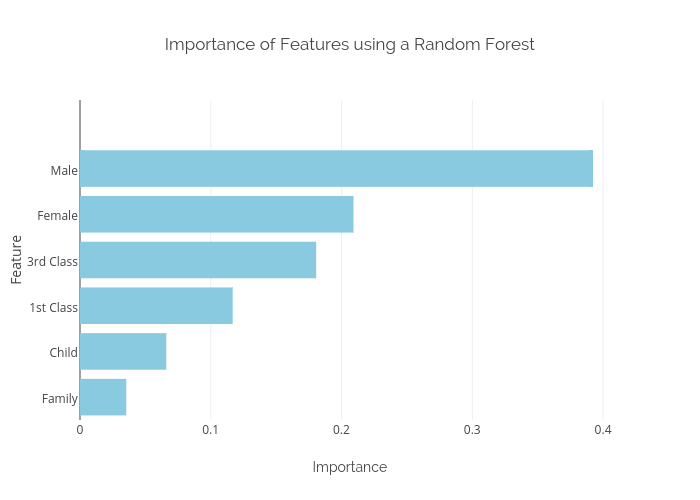
Sagarwal88's interactive graph and data of "Importance of Features using a Random Forest" is a bar chart, showing A; with Importance in the x-axis and Feature in the y-axis.. The x-axis shows values from 0 to 0.4128609844169764. The y-axis shows values from -0.5 to 6.5.