Edit chart
Loading graph
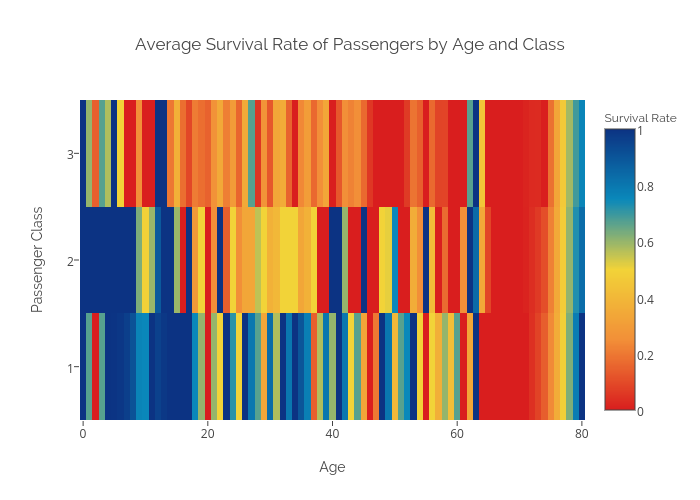
Sagarwal88's interactive graph and data of "Average Survival Rate of Passengers by Age and Class" is a heatmap; with Age in the x-axis and Passenger Class in the y-axis.. The x-axis shows values from -0.5 to 80.5. The y-axis shows values from 0.5 to 3.5.