Edit chart
Loading graph
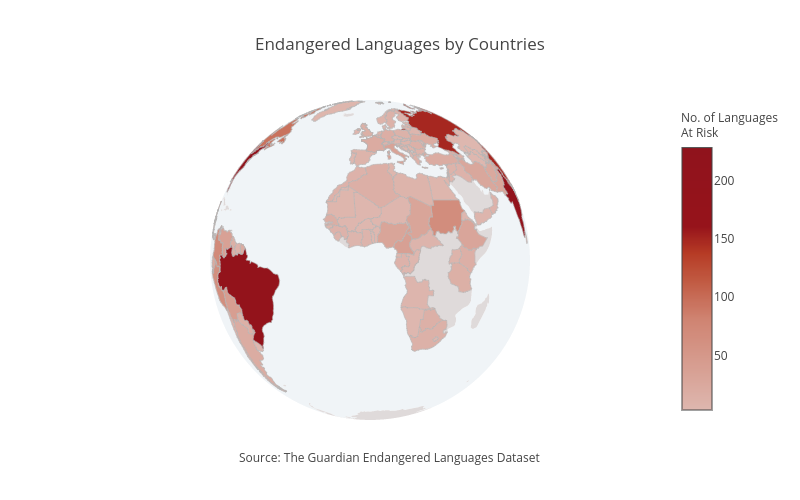
Sagarwal88's interactive graph and data of "Endangered Languages by Countries" is a choropleth. The x-axis shows values from 0 to 0. The y-axis shows values from 0 to 0. This visualization has the following annotation: Source: The Guardian Endangered Languages Dataset