Edit chart
Loading graph
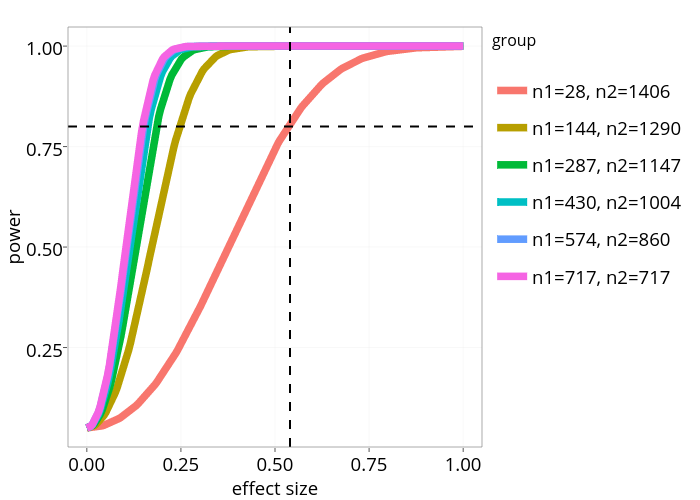
Sahirbhatnagar's interactive graph and data of "power vs effect size" is a line chart, showing n1=28, n2=1406, n1=144, n2=1290, n1=287, n2=1147, n1=430, n2=1004, n1=574, n2=860, n1=717, n2=717, , ; with effect size in the x-axis and power in the y-axis.. The x-axis shows values from -0.05 to 1.05. The y-axis shows values from 0.00250000000000006 to 1.0475. This visualization has the following annotation: group