Edit chart
Loading graph
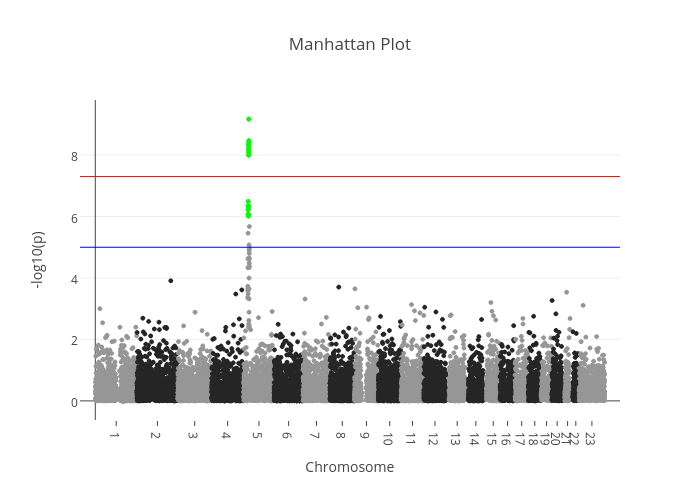
Sahirbhatnagar's interactive graph and data of "Manhattan Plot" is a scatter chart, showing chr1, chr2, chr3, chr4, chr5, chr6, chr7, chr8, chr9, chr10, chr11, chr12, chr13, chr14, chr15, chr16, chr17, chr18, chr19, chr20, chr21, chr22, chr23, of interest; with Chromosome in the x-axis and -log10(p) in the y-axis.. The x-axis shows values from -90422231 to 3104496578. The y-axis shows values from 0 to 0.