Edit chart
Loading graph
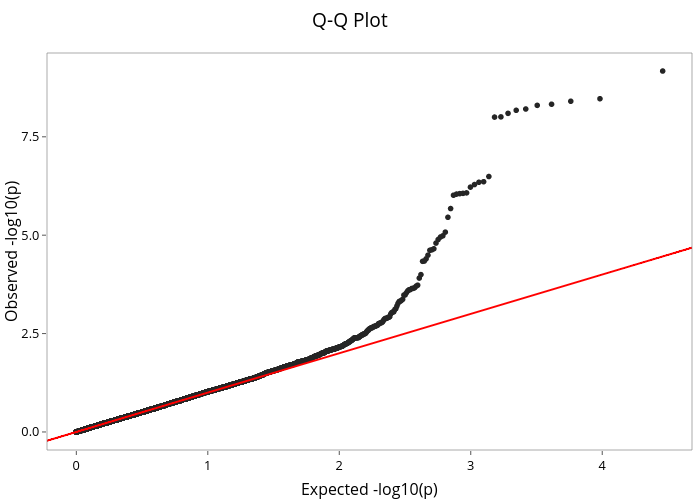
Sahirbhatnagar's interactive graph and data of "Q-Q Plot" is a scatter chart, showing vs ; with Expected -log10(p) in the x-axis and Observed -log10(p) in the y-axis.. The x-axis shows values from -0.222971891712025 to 4.68274120820149. The y-axis shows values from -0.458509312394733 to 9.62922308396807.