Edit chart
Loading graph
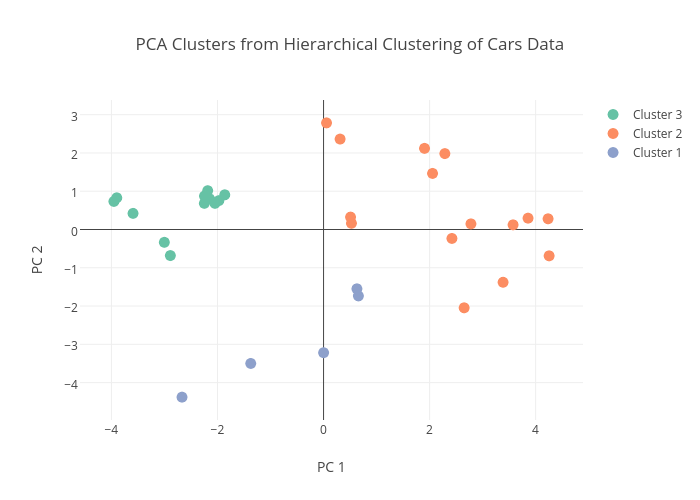
Sahirbhatnagar's interactive graph and data of "PCA Clusters from Hierarchical Clustering of Cars Data" is a scatter chart, showing Cluster 3, Cluster 2, Cluster 1; with PC 1 in the x-axis and PC 2 in the y-axis.. The x-axis shows values from 0 to 0. The y-axis shows values from 0 to 0.