Edit chart
Loading graph
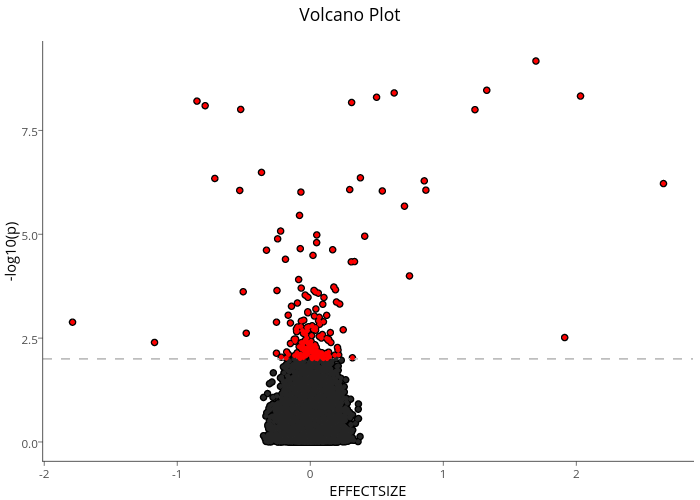
Sahirbhatnagar's interactive graph and data of "Volcano Plot" is a scatter chart, showing , , of interest; with EFFECTSIZE in the x-axis and -log10(p) in the y-axis.. The x-axis shows values from -2.00941 to 2.87701. The y-axis shows values from -0.458509312394733 to 9.62922308396807.