Edit chart
Loading graph
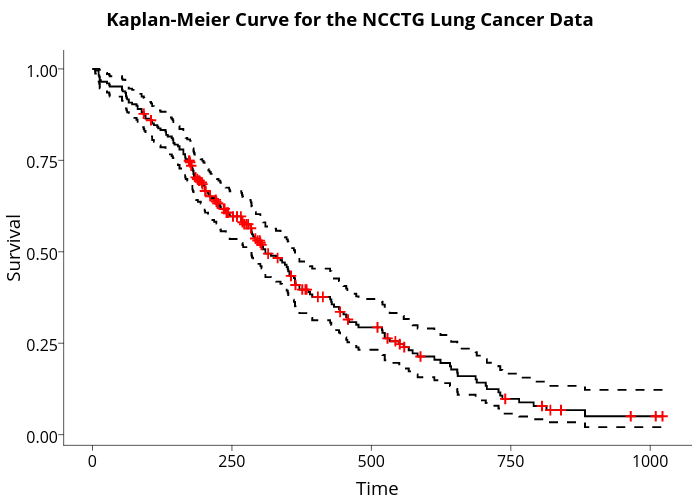
Sahirbhatnagar's interactive graph and data of " Kaplan-Meier Curve for the NCCTG Lung Cancer Data " is a line chart, showing , , , ; with Time in the x-axis and Survival in the y-axis.. The x-axis shows values from -51.1 to 1073.1. The y-axis shows values from -0.028280266791071 to 1.04896572699005.