Edit chart
Loading graph
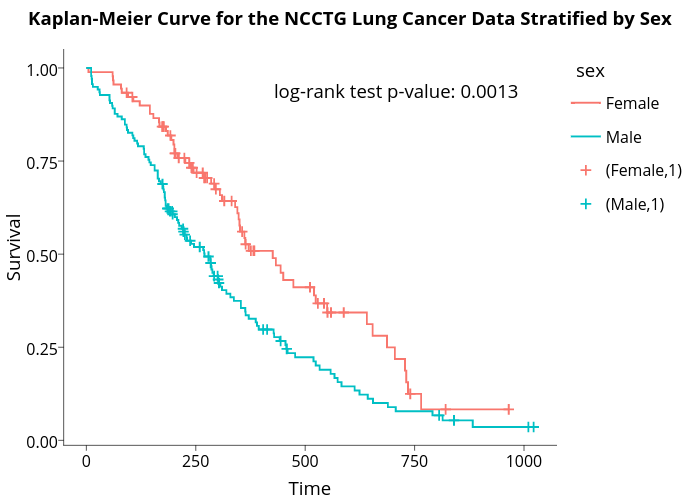
Sahirbhatnagar's interactive graph and data of " Kaplan-Meier Curve for the NCCTG Lung Cancer Data Stratified by Sex " is a line chart, showing Female, Male, (Female,1), (Male,1); with Time in the x-axis and Survival in the y-axis.. The x-axis shows values from -51.1 to 1073.1. The y-axis shows values from -0.0125004361918307 to 1.04821430648533. This visualization has the following annotations: sex; log-rank test p-value: 0.0013