Edit chart
Loading graph
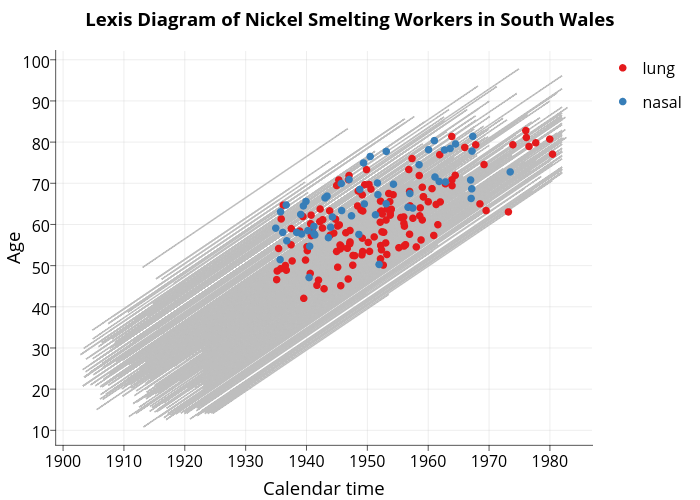
Sahirbhatnagar's interactive graph and data of " Lexis Diagram of Nickel Smelting Workers in South Wales " is a line chart, showing , lung, nasal; with Calendar time in the x-axis and Age in the y-axis.. The x-axis shows values from 1898.837535 to 1986.915965. The y-axis shows values from 6.433875 to 102.127825.