Edit chart
Loading graph
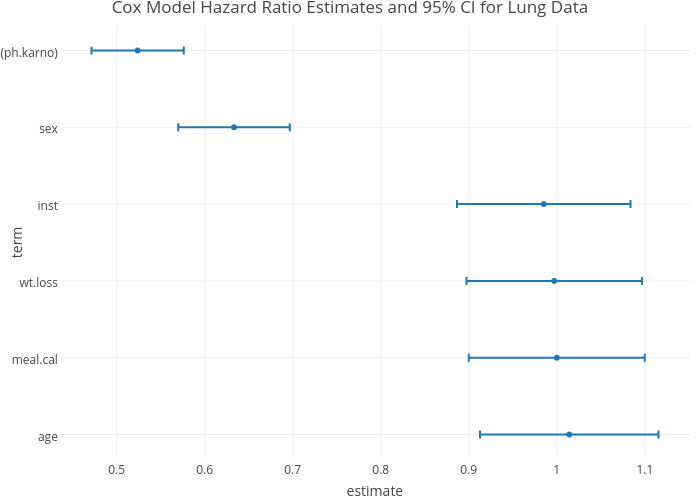
Sahirbhatnagar's interactive graph and data of "Cox Model Hazard Ratio Estimates and 95% CI for Lung Data" is a scatter chart; with estimate in the x-axis and term in the y-axis.. The x-axis shows values from 0 to 0. The y-axis shows values from 0 to 0.