Edit chart
Loading graph
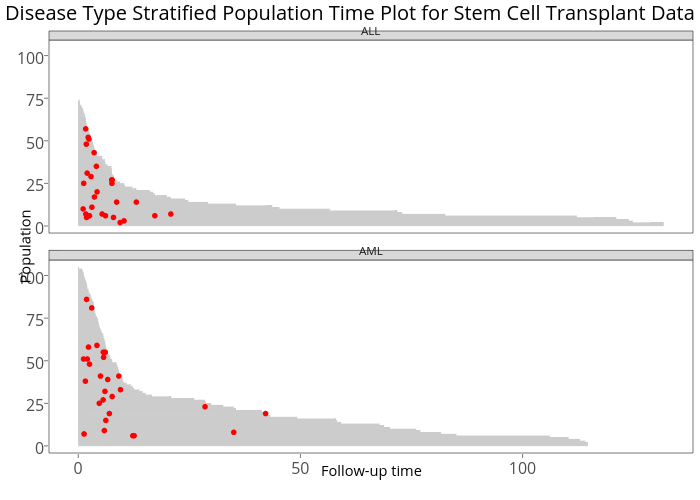
Sahirbhatnagar's interactive graph and data of "Disease Type Stratified Population Time Plot for Stem Cell Transplant Data" is a line chart, showing , , , . The x-axis shows values from -6.5885 to 138.3585. The y-axis shows values from -4.15 to 109.15. This visualization has the following annotations: Follow-up time; Population; ALL; AML