Edit chart
Loading graph
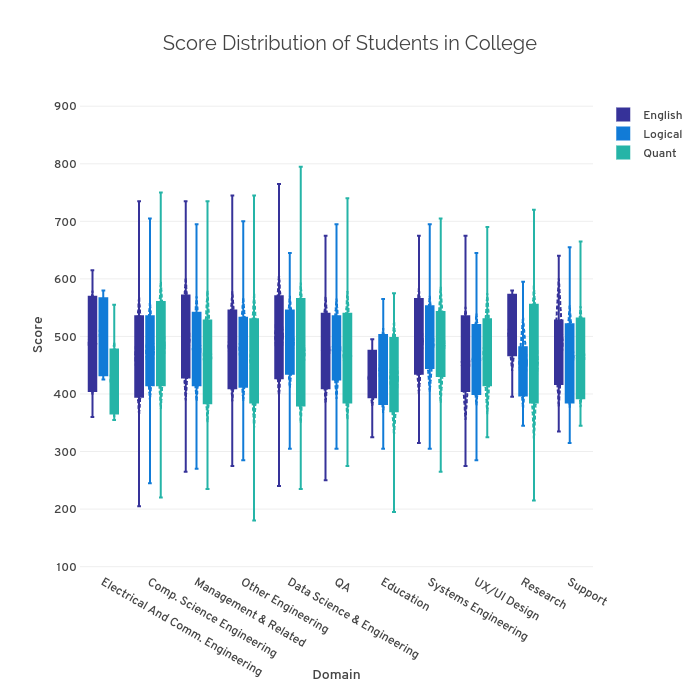
Sanpal's interactive graph and data of "Score Distribution of Students in College" is a box plot, showing English, Logical, Quant; with Domain in the x-axis and Score in the y-axis.. The x-axis shows values from -0.5 to 10.5. The y-axis shows values from 94.16666666666666 to 910.8333333333334.