Edit chart
Loading graph
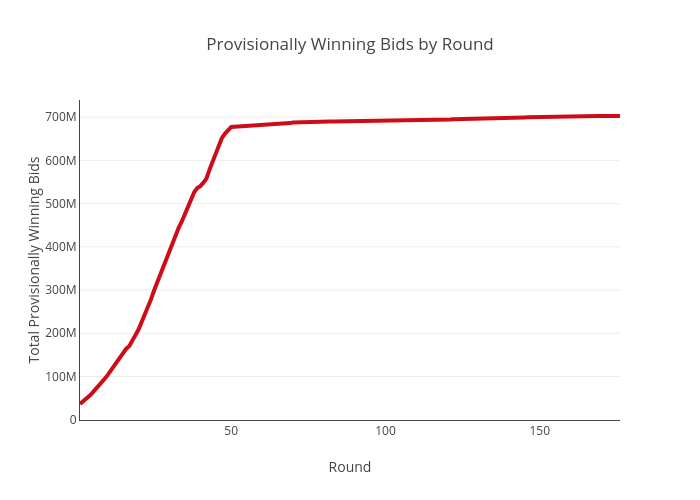
Sashajavid's interactive graph and data of "Provisionally Winning Bids by Round" is a scatter chart, showing Total Provisionally Winning Bids By Round; with Round in the x-axis and Total Provisionally Winning Bids in the y-axis.. The x-axis shows values from 0 to 0. The y-axis shows values from 0 to 0.