Edit chart
Loading graph
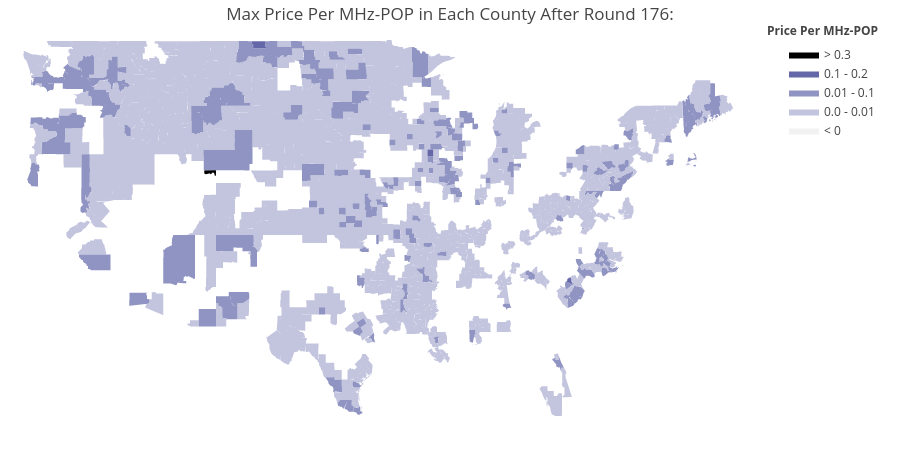
Sashajavid's interactive graph and data of "Max Price Per MHz-POP in Each County After Round 176:" is a filled line chart, showing 0.3, US Counties. The x-axis shows values from -125.0 to -55.0. The y-axis shows values from 24.93103448275862 to 49.06896551724138. This visualization has the following annotation: Price Per MHz-POP