Edit chart
Loading graph
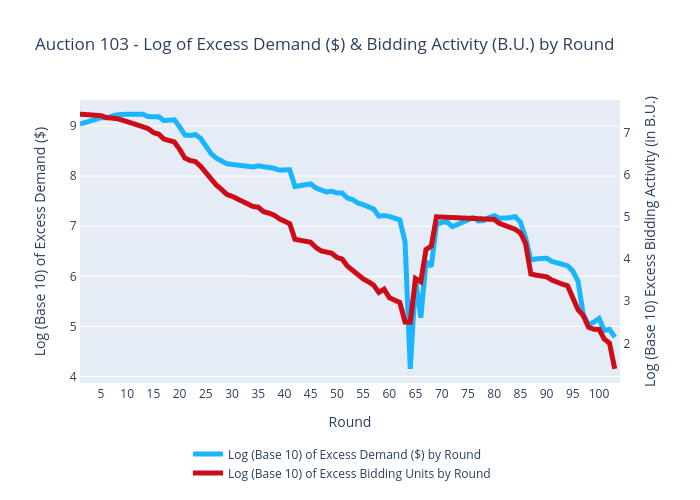
Sashajavid's interactive graph and data of "Auction 103 - Log of Excess Demand ($) & Bidding Activity (B.U.) by Round" is a scatter chart, showing Log (Base 10) of Excess Demand ($) by Round vs Log (Base 10) of Excess Bidding Units by Round; with Round in the x-axis and Log (Base 10) of Excess Demand ($) in the y-axis.. The x-axis shows values from 0 to 0. The y-axis shows values from 0 to 0.