Edit chart
Loading graph
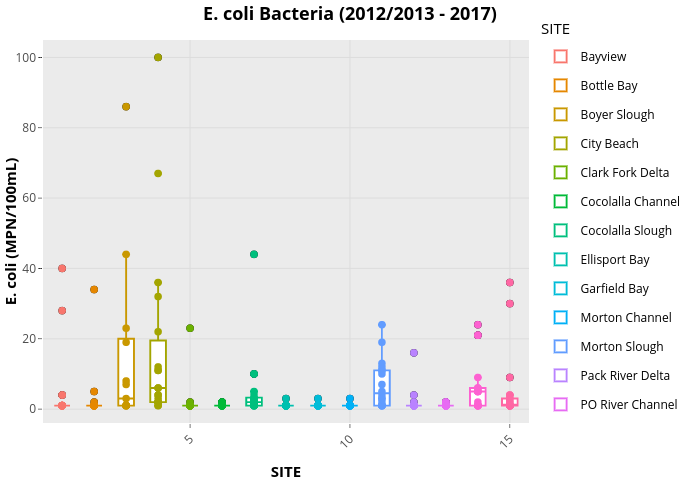
Scohen23's interactive graph and data of " E. coli Bacteria (2012/2013 - 2017) " is a box plot, showing Bayview, Bottle Bay, Boyer Slough, City Beach, Clark Fork Delta, Cocolalla Channel, Cocolalla Slough, Ellisport Bay, Garfield Bay, Morton Channel, Morton Slough, Pack River Delta, PO River Channel, Priest River, SPWWOF, Bayview, Bottle Bay, Boyer Slough, City Beach, Clark Fork Delta, Cocolalla Channel, Cocolalla Slough, Ellisport Bay, Garfield Bay, Morton Channel, Morton Slough, Pack River Delta, PO River Channel, Priest River, SPWWOF; with SITE in the x-axis and E. coli (MPN/100mL) in the y-axis.. The x-axis shows values from 0.4 to 15.6. The y-axis shows values from -3.95 to 104.95. This visualization has the following annotation: SITE