Edit chart
Loading graph
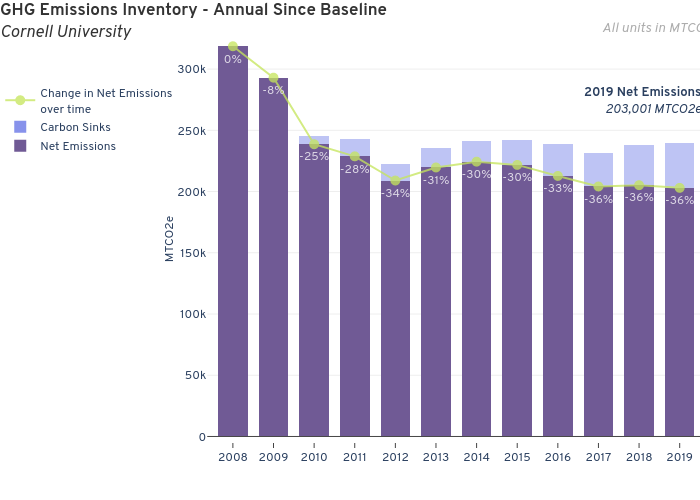
Seb382's interactive graph and data of "GHG Emissions Inventory - Annual Since BaselineCornell University" is a stacked bar chart, showing Net Emissions, Carbon Sinks, Change in Net Emissionsover time; with in the x-axis and MTCO2e in the y-axis.. The x-axis shows values from 2007.3687937319312 to 2019.5. The y-axis shows values from -9402.564552688695 to 331900.999083675. This visualization has the following annotations: 2019 Net Emissions203,001 MTCO2e; All units in MTCO2e