Edit chart
Loading graph
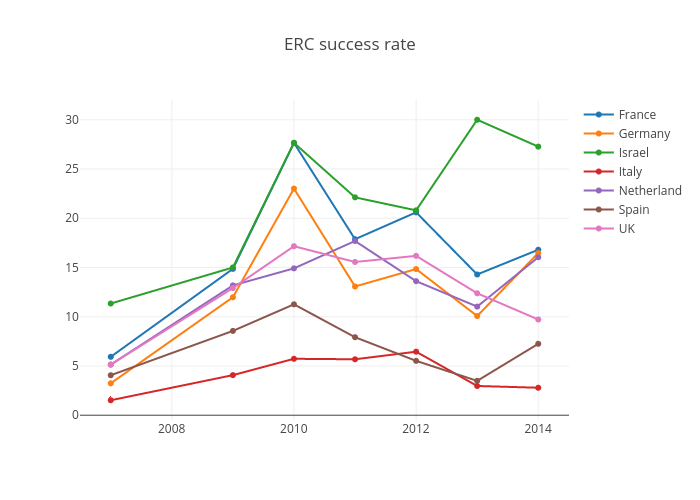
Sergio_cima's interactive graph and data of "ERC success rate" is a scatter chart, showing France, Germany, Israel, Italy, Netherland, Spain, UK. The x-axis shows values from 2006.5092783505154 to 2014.4907216494846. The y-axis shows values from -0.39800792303339017 to 31.91800792303339.