Edit chart
Loading graph
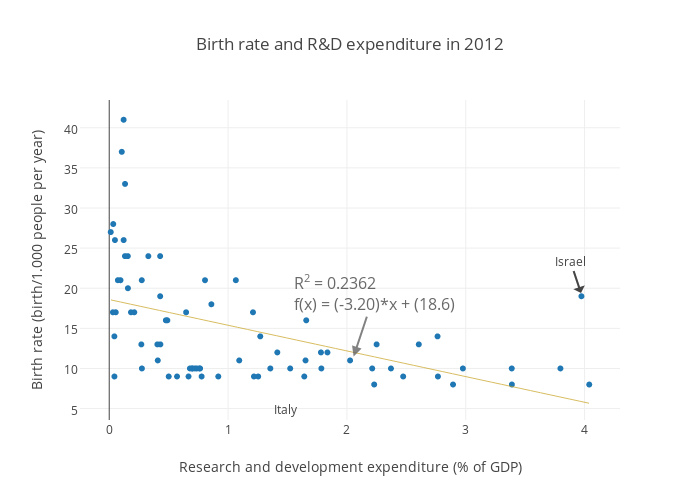
Sergio_cima's interactive graph and data of "Birth rate and R&D expenditure in 2012" is a scatter chart, showing Birth rate (birth/1.000 people per year) vs Birth rate (birth/1.000 people per year) - fit; with Research and development expenditure (% of GDP) in the x-axis and Birth rate (birth/1.000 people per year) in the y-axis.. The x-axis shows values from -0.23166860066989206 to 4.283688600669891. The y-axis shows values from 3.680843305174181 to 43.26062913365719. This visualization has the following annotations: R2 = 0.2362f(x) = (-3.20)*x + (18.6); Israel; Italy