Edit chart
Loading graph
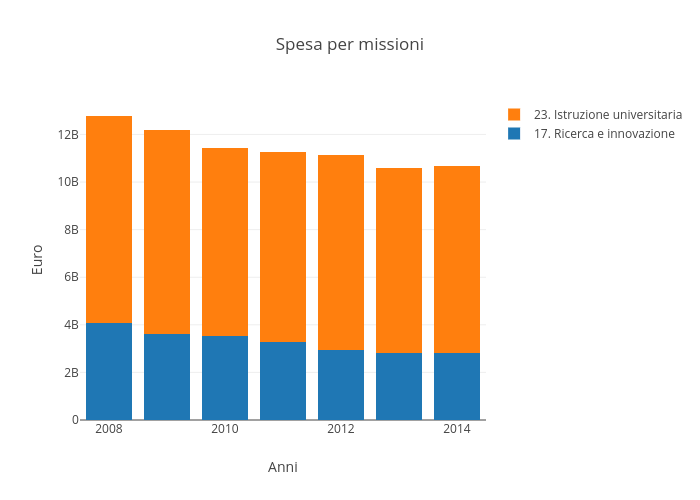
Sergio_cima's interactive graph and data of "Spesa per missioni" is a filled stacked bar chart, showing 17. Ricerca e innovazione vs 23. Istruzione universitaria; with Anni in the x-axis and Euro in the y-axis.. The x-axis shows values from 2007.5 to 2014.5. The y-axis shows values from 0 to 13447368421.052631.