Edit chart
Loading graph
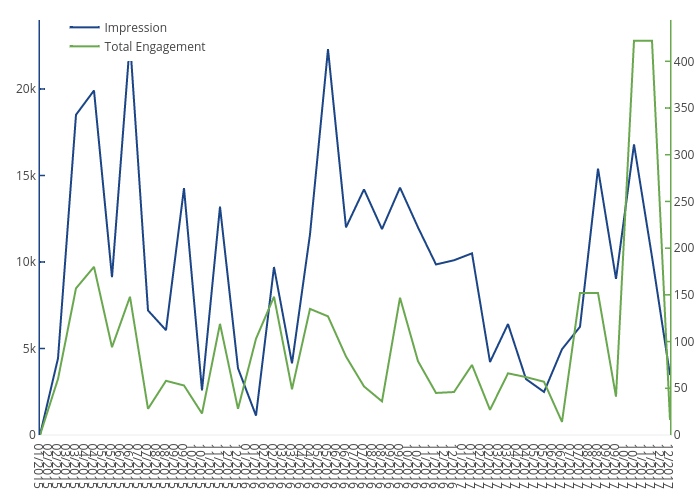
Sergio_cima's interactive graph and data of "Impression vs Total Engagement" is a scatter chart, showing Impression vs Total Engagement. The x-axis shows values from 0 to 32. The y-axis shows values from 0 to 23987.368421052633.